
Insurers have been slow to pass on savings to consumers and are remarkably quick to shift fault elsewhere, presenting themselves as blameless observers in the debate on rising premiums.
In March, Minister Robert Troy launched a new Motor Insurance Transparency Code. Insurers can choose to opt in, if they wish, but they are not obliged to do so.
One crucial element consistently missing from the industry’s narrative is its own costs and profits.
Data from the Central Bank’s National Claims Information Database (NCID) clearly shows that insurers’ operating costs and profits exceed the total paid out on claims and are several times higher than legal or other associated costs.
The current public debate has been shaped by a long‑running and effective effort by the insurance industry to deflect scrutiny from its own role in driving up premiums. Successive NCID reports highlight the same stark fact: the single largest cost in Irish insurance premiums is the portion retained by insurers themselves — the industry’s “price‑cost mark‑up.”
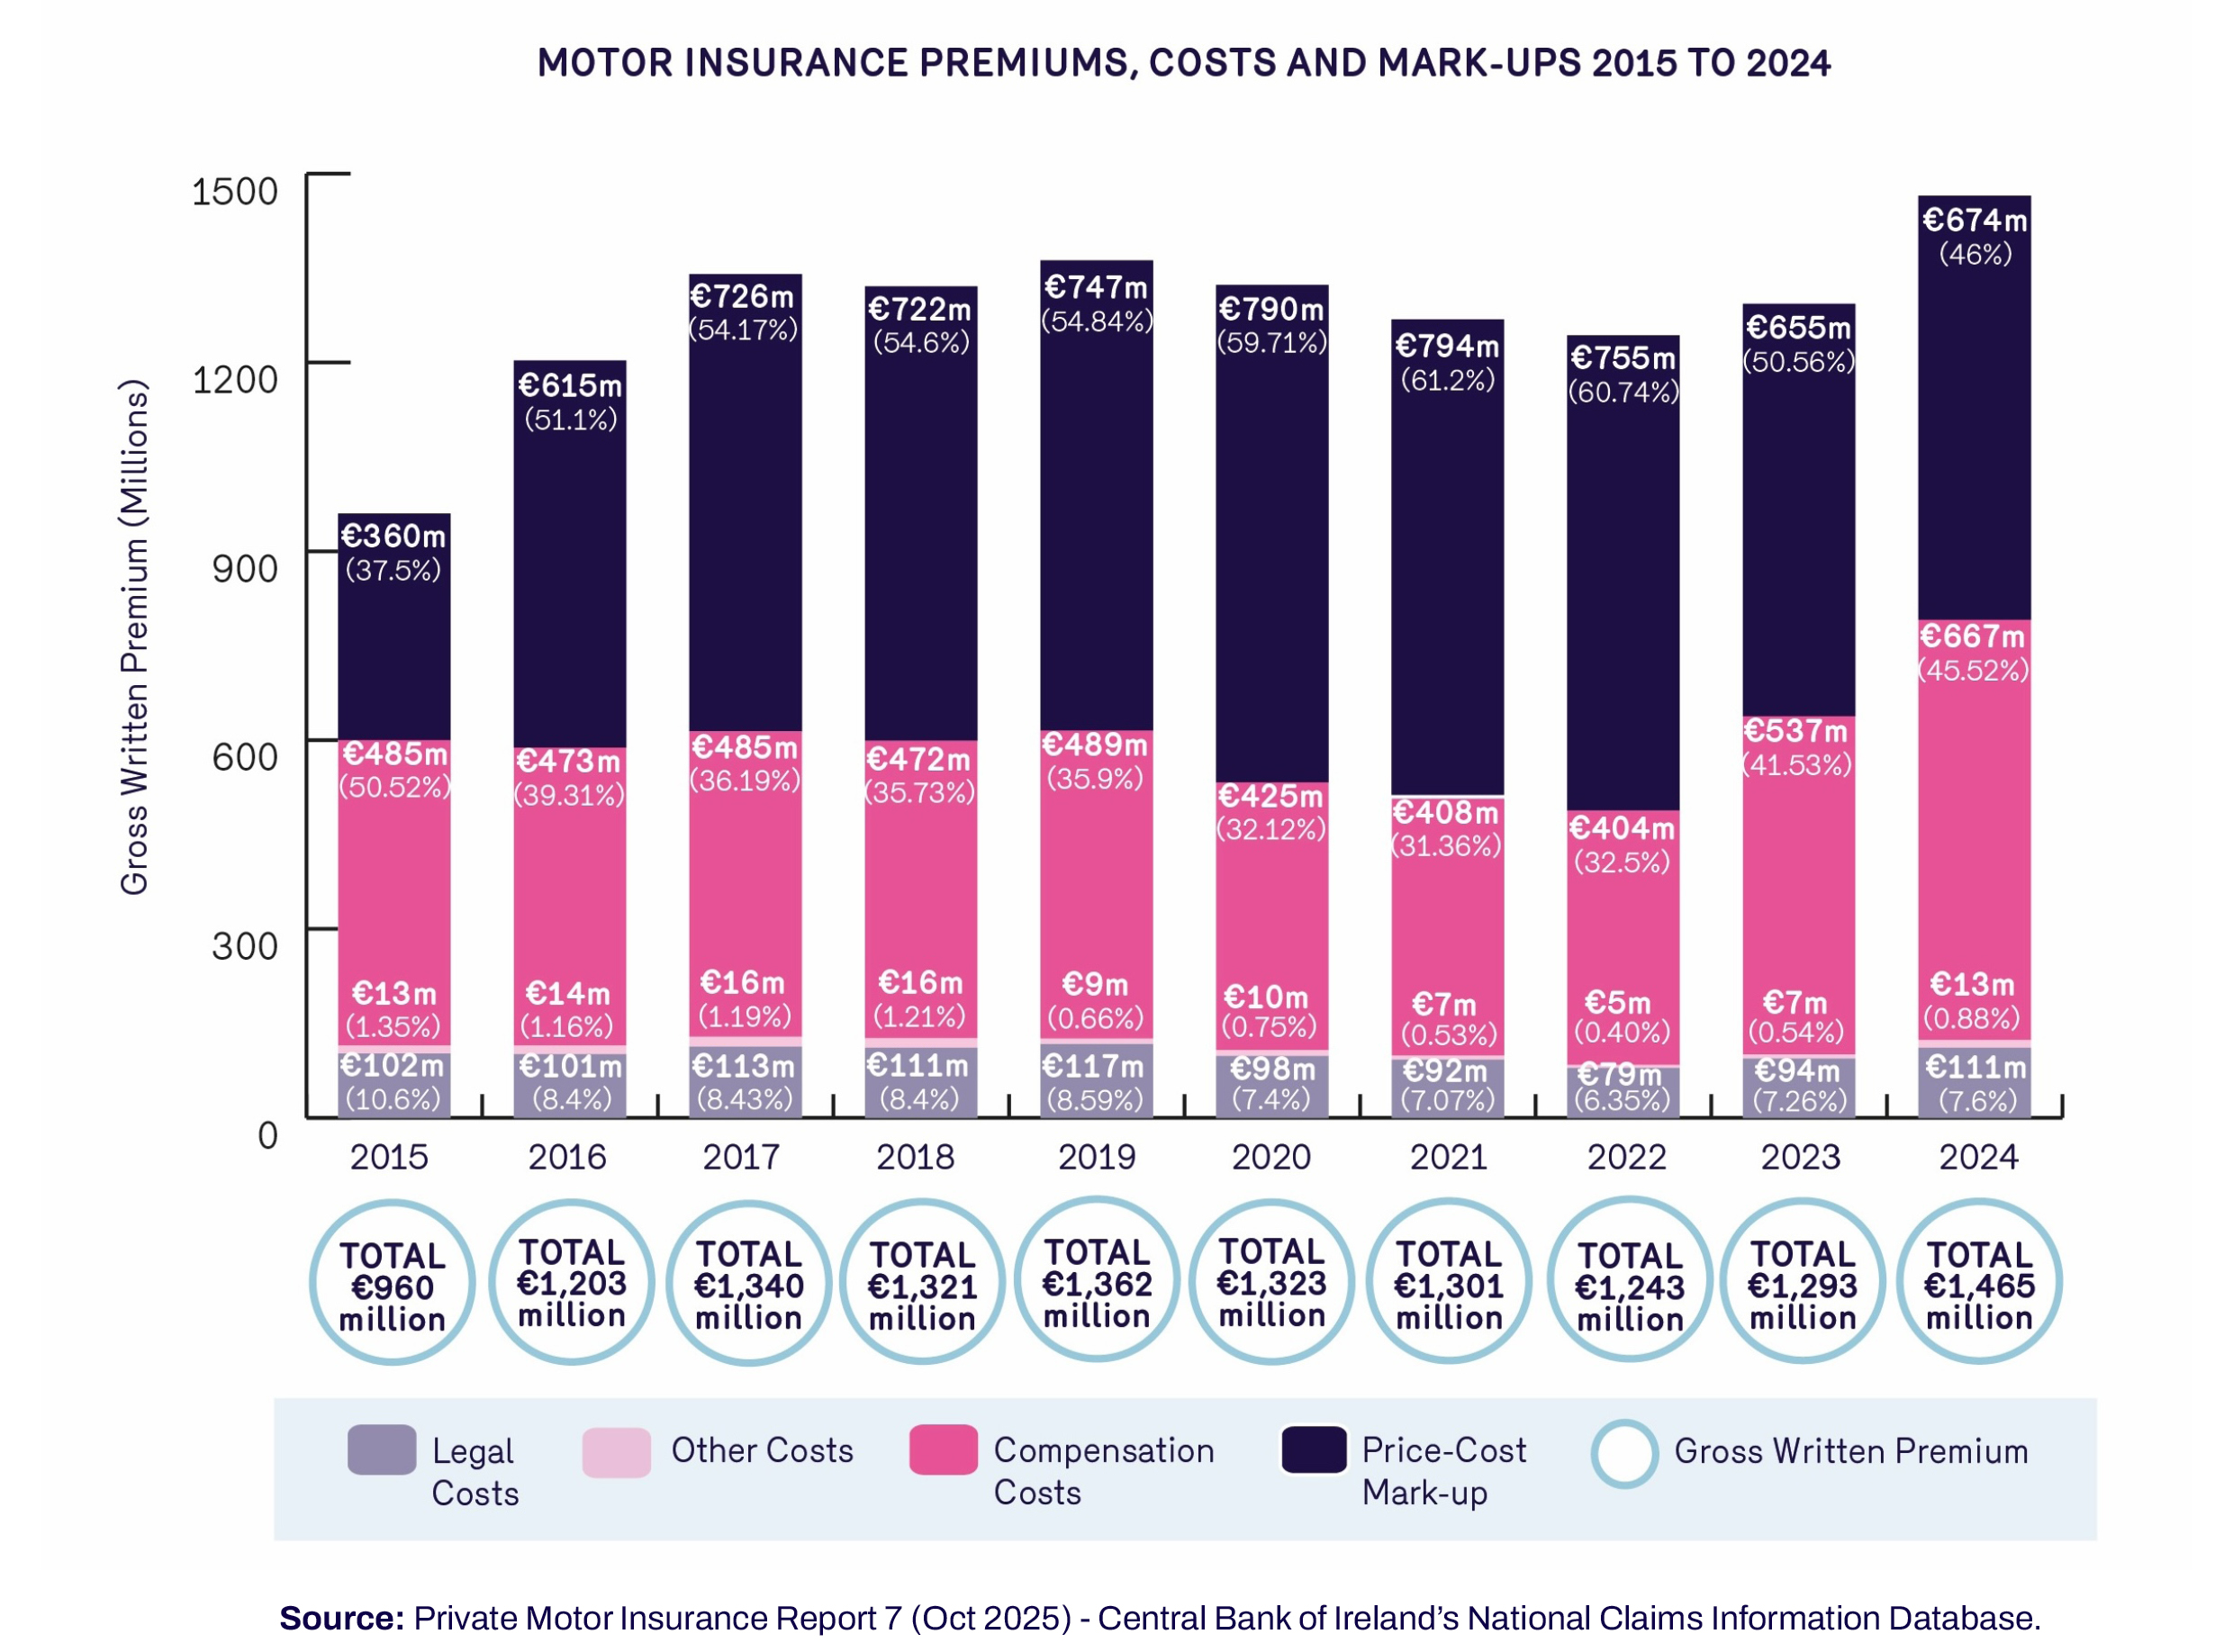
By way of example the price-cost mark-up on motor insurance in each of the past 5 years was as follows:
- 7% (€790m) in 2020;
- 2% (€794m) in 2021;
- 7% (€755m) in 2022;
- 6% (€655m) in 2023;
- 46% (€674m) in 2024[1].
In each of the last five years, the costs incurred by the insurance companies themselves constitute more than the pure compensation costs paid out to claimants covered by the insurance.
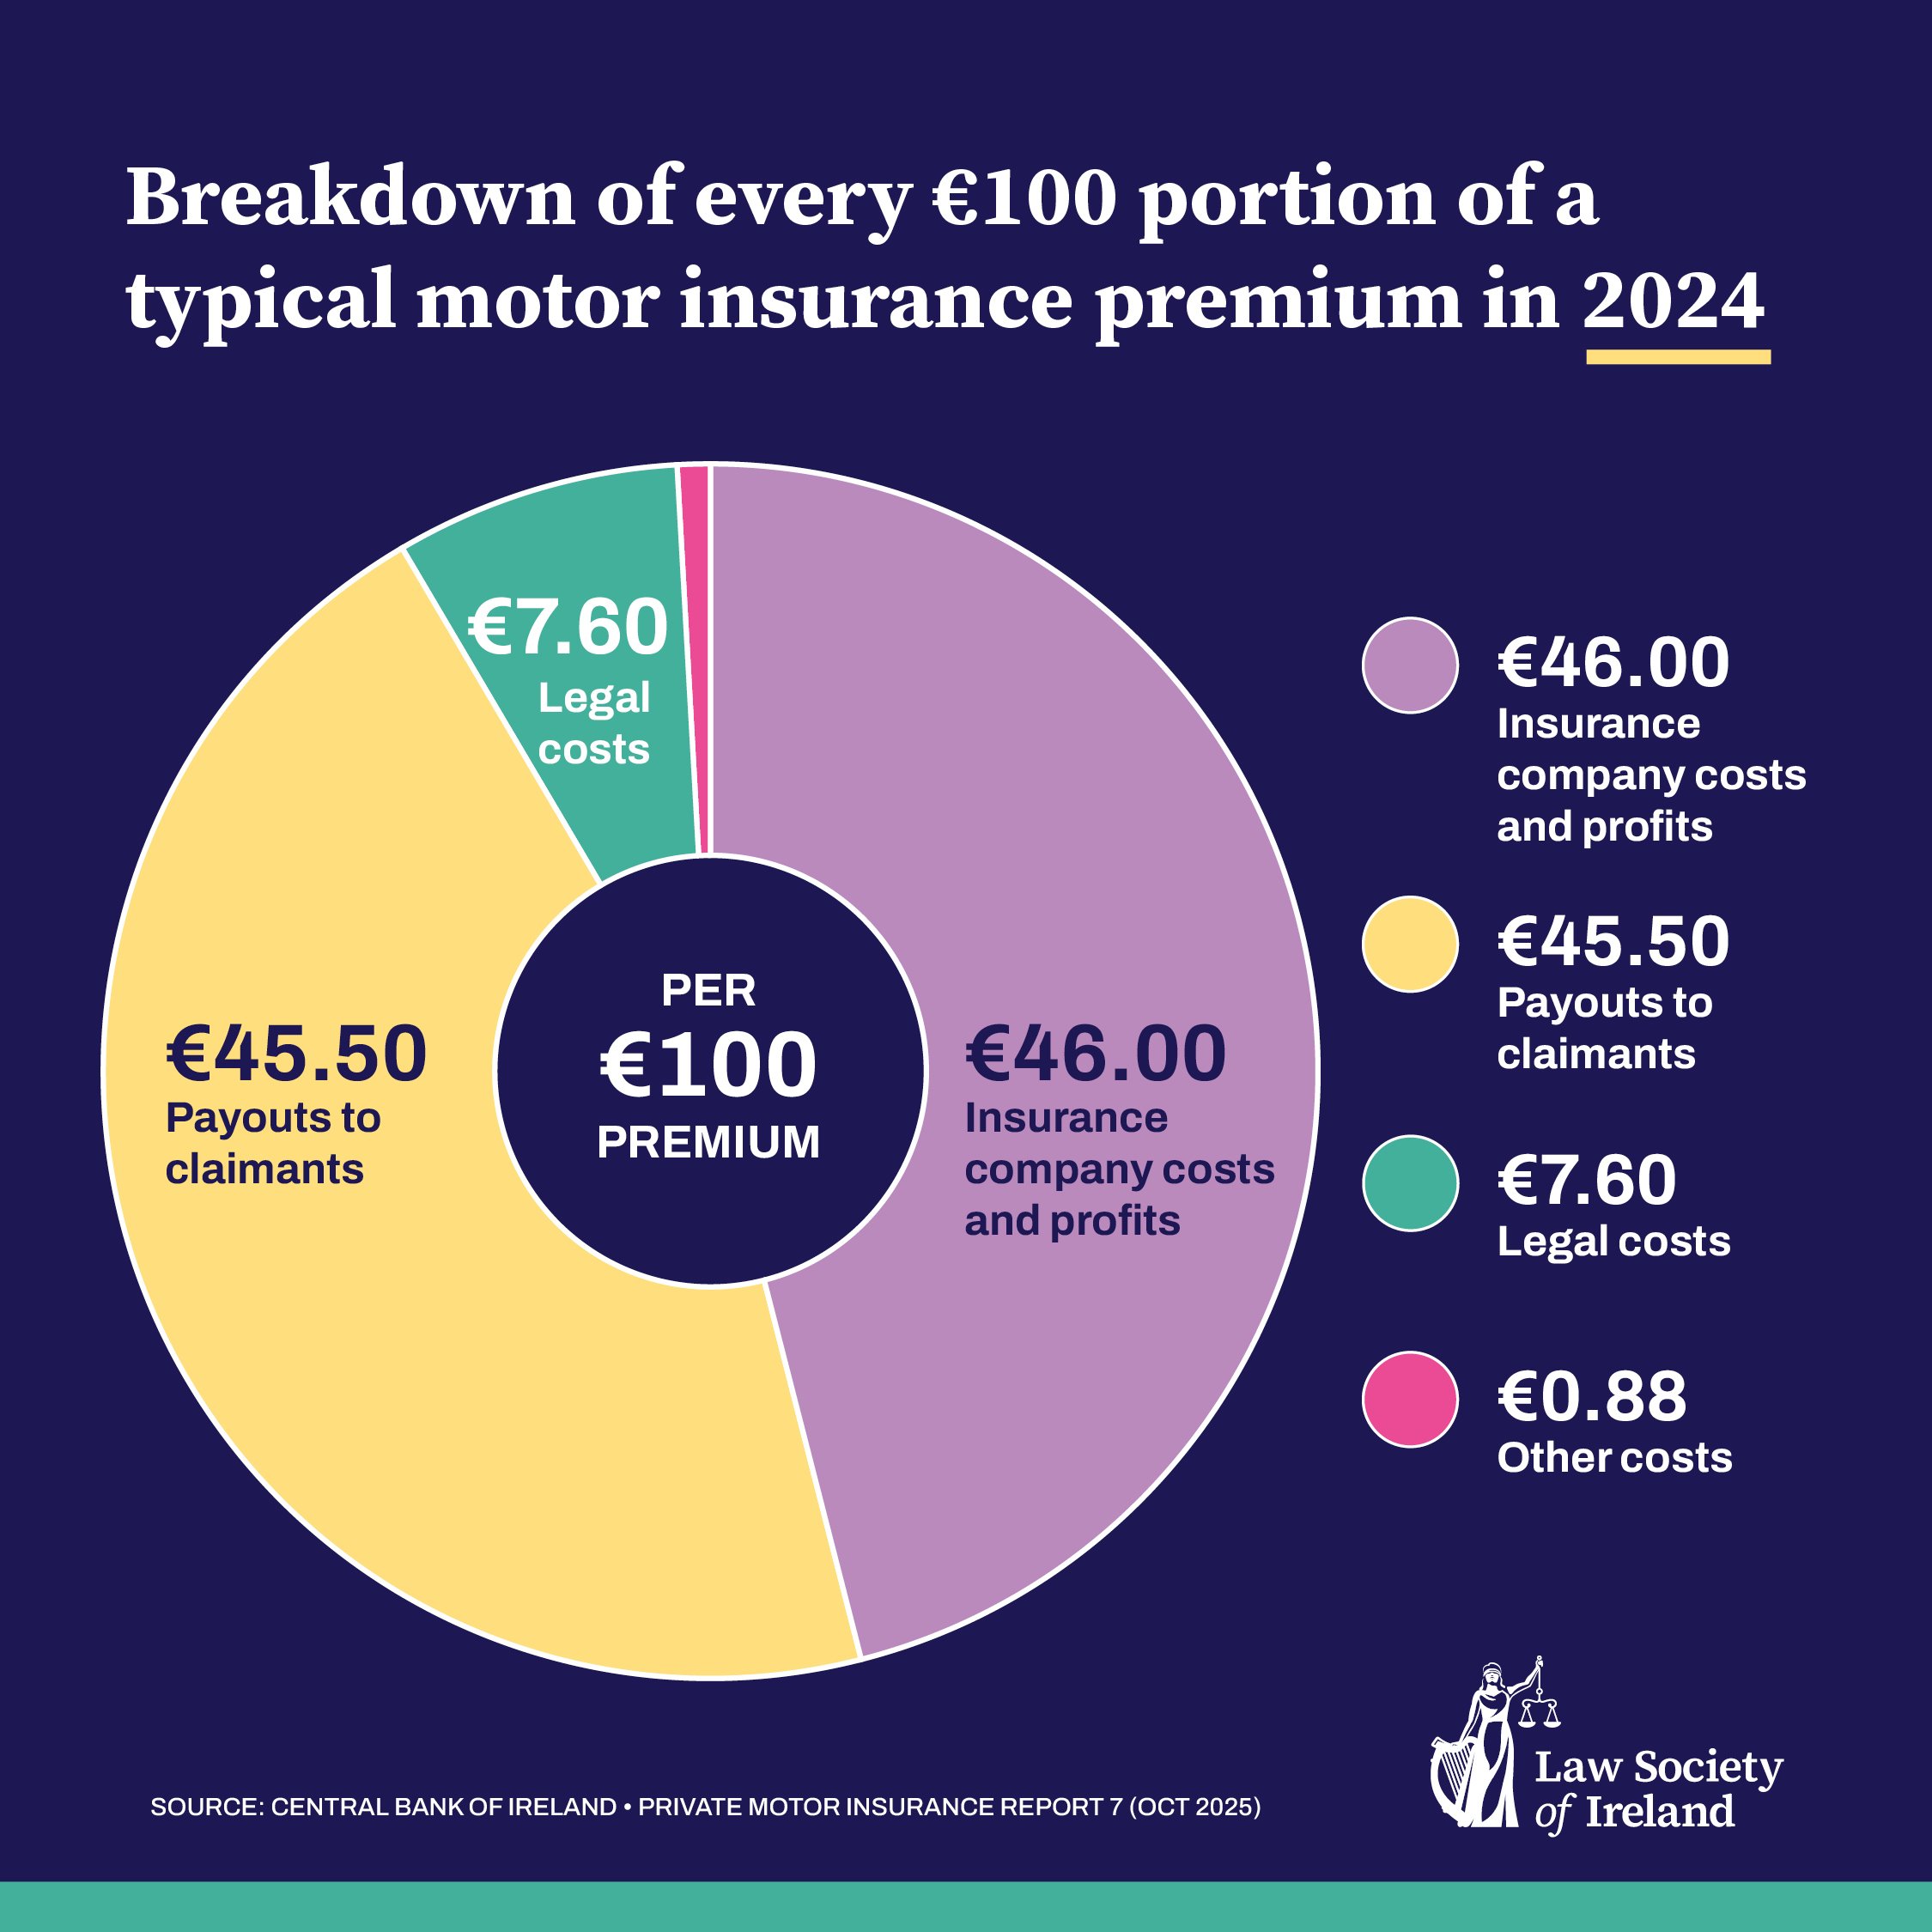
Taking NCID data from 2024[2], the Law Society has outlined how every €100 of a typical motor premium paid by a consumer is broken down – see Figure 1.
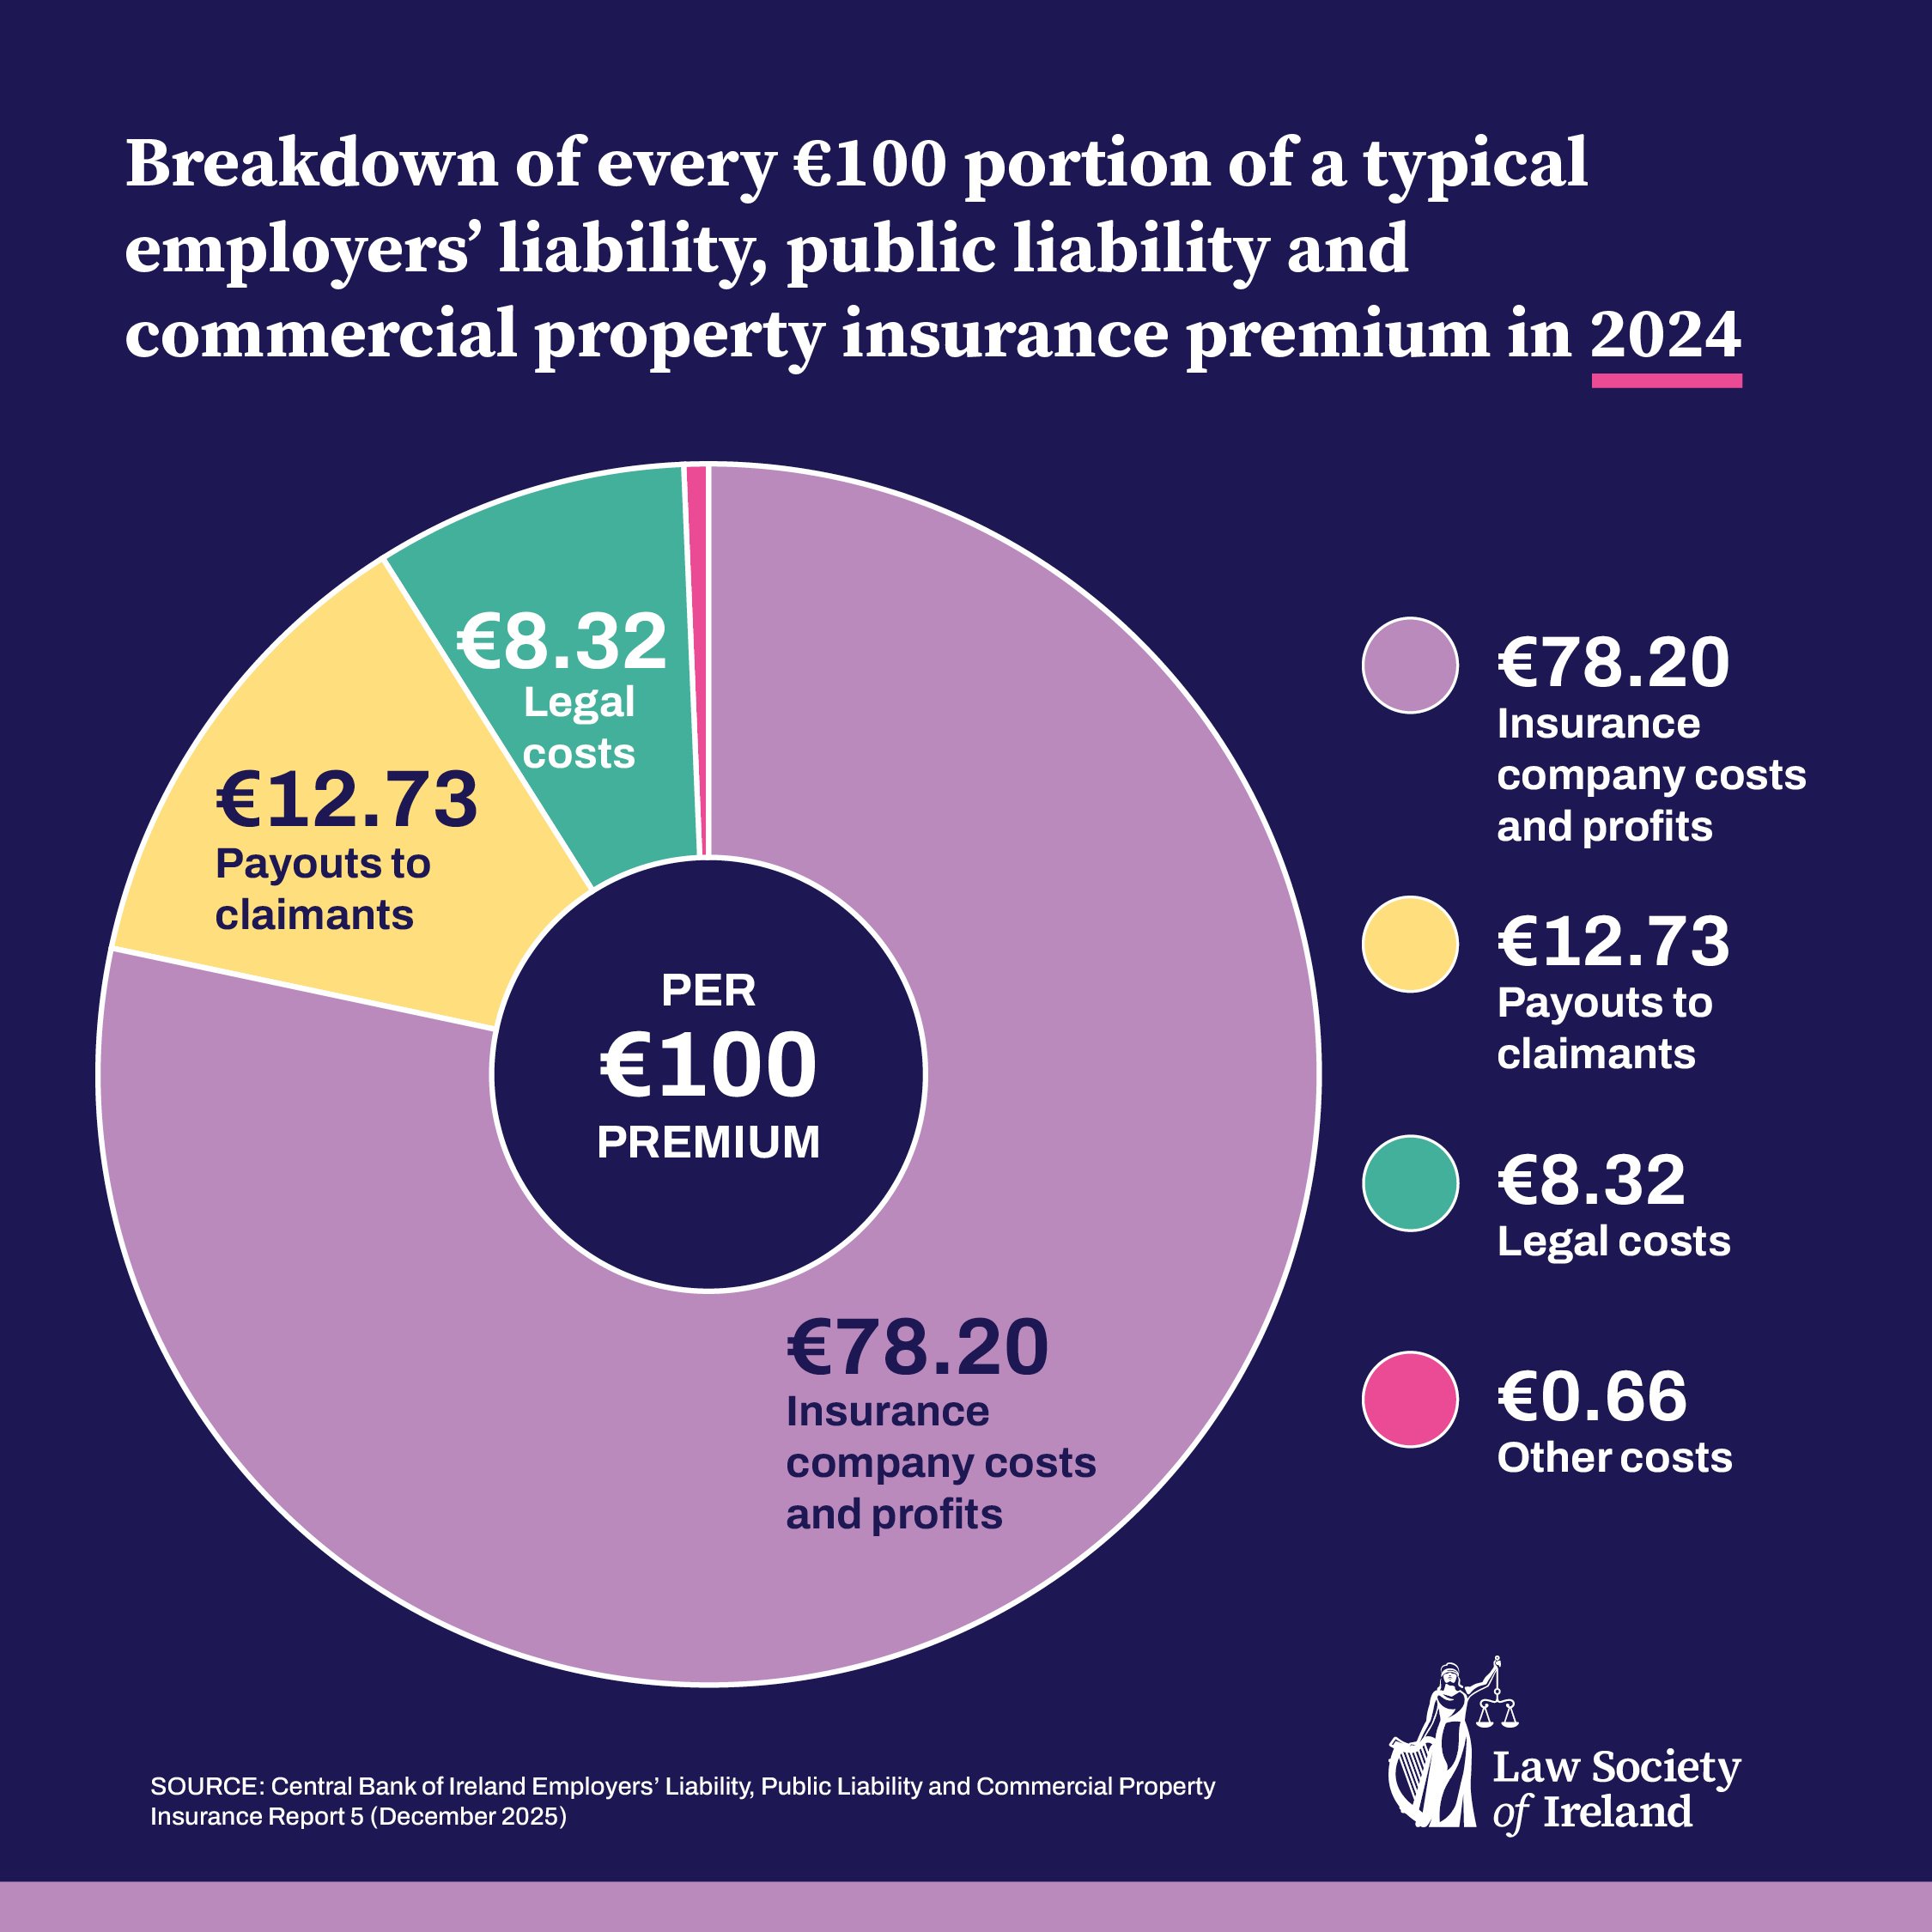
Taking NCID data from 2024[3], we have outlined how every €100 of a typical Employers’ Liability, Public Liability and Commercial Property Insurance premium is broken down – see Figure 2 below:
When you look at the data available from the Central Bank over the last ten years,[4] it shows that, in respect of motor insurance, in nine of those ten years, the costs and profits of the insurers themselves was greater than payments made to those who are insured - and in some years this was significantly so.
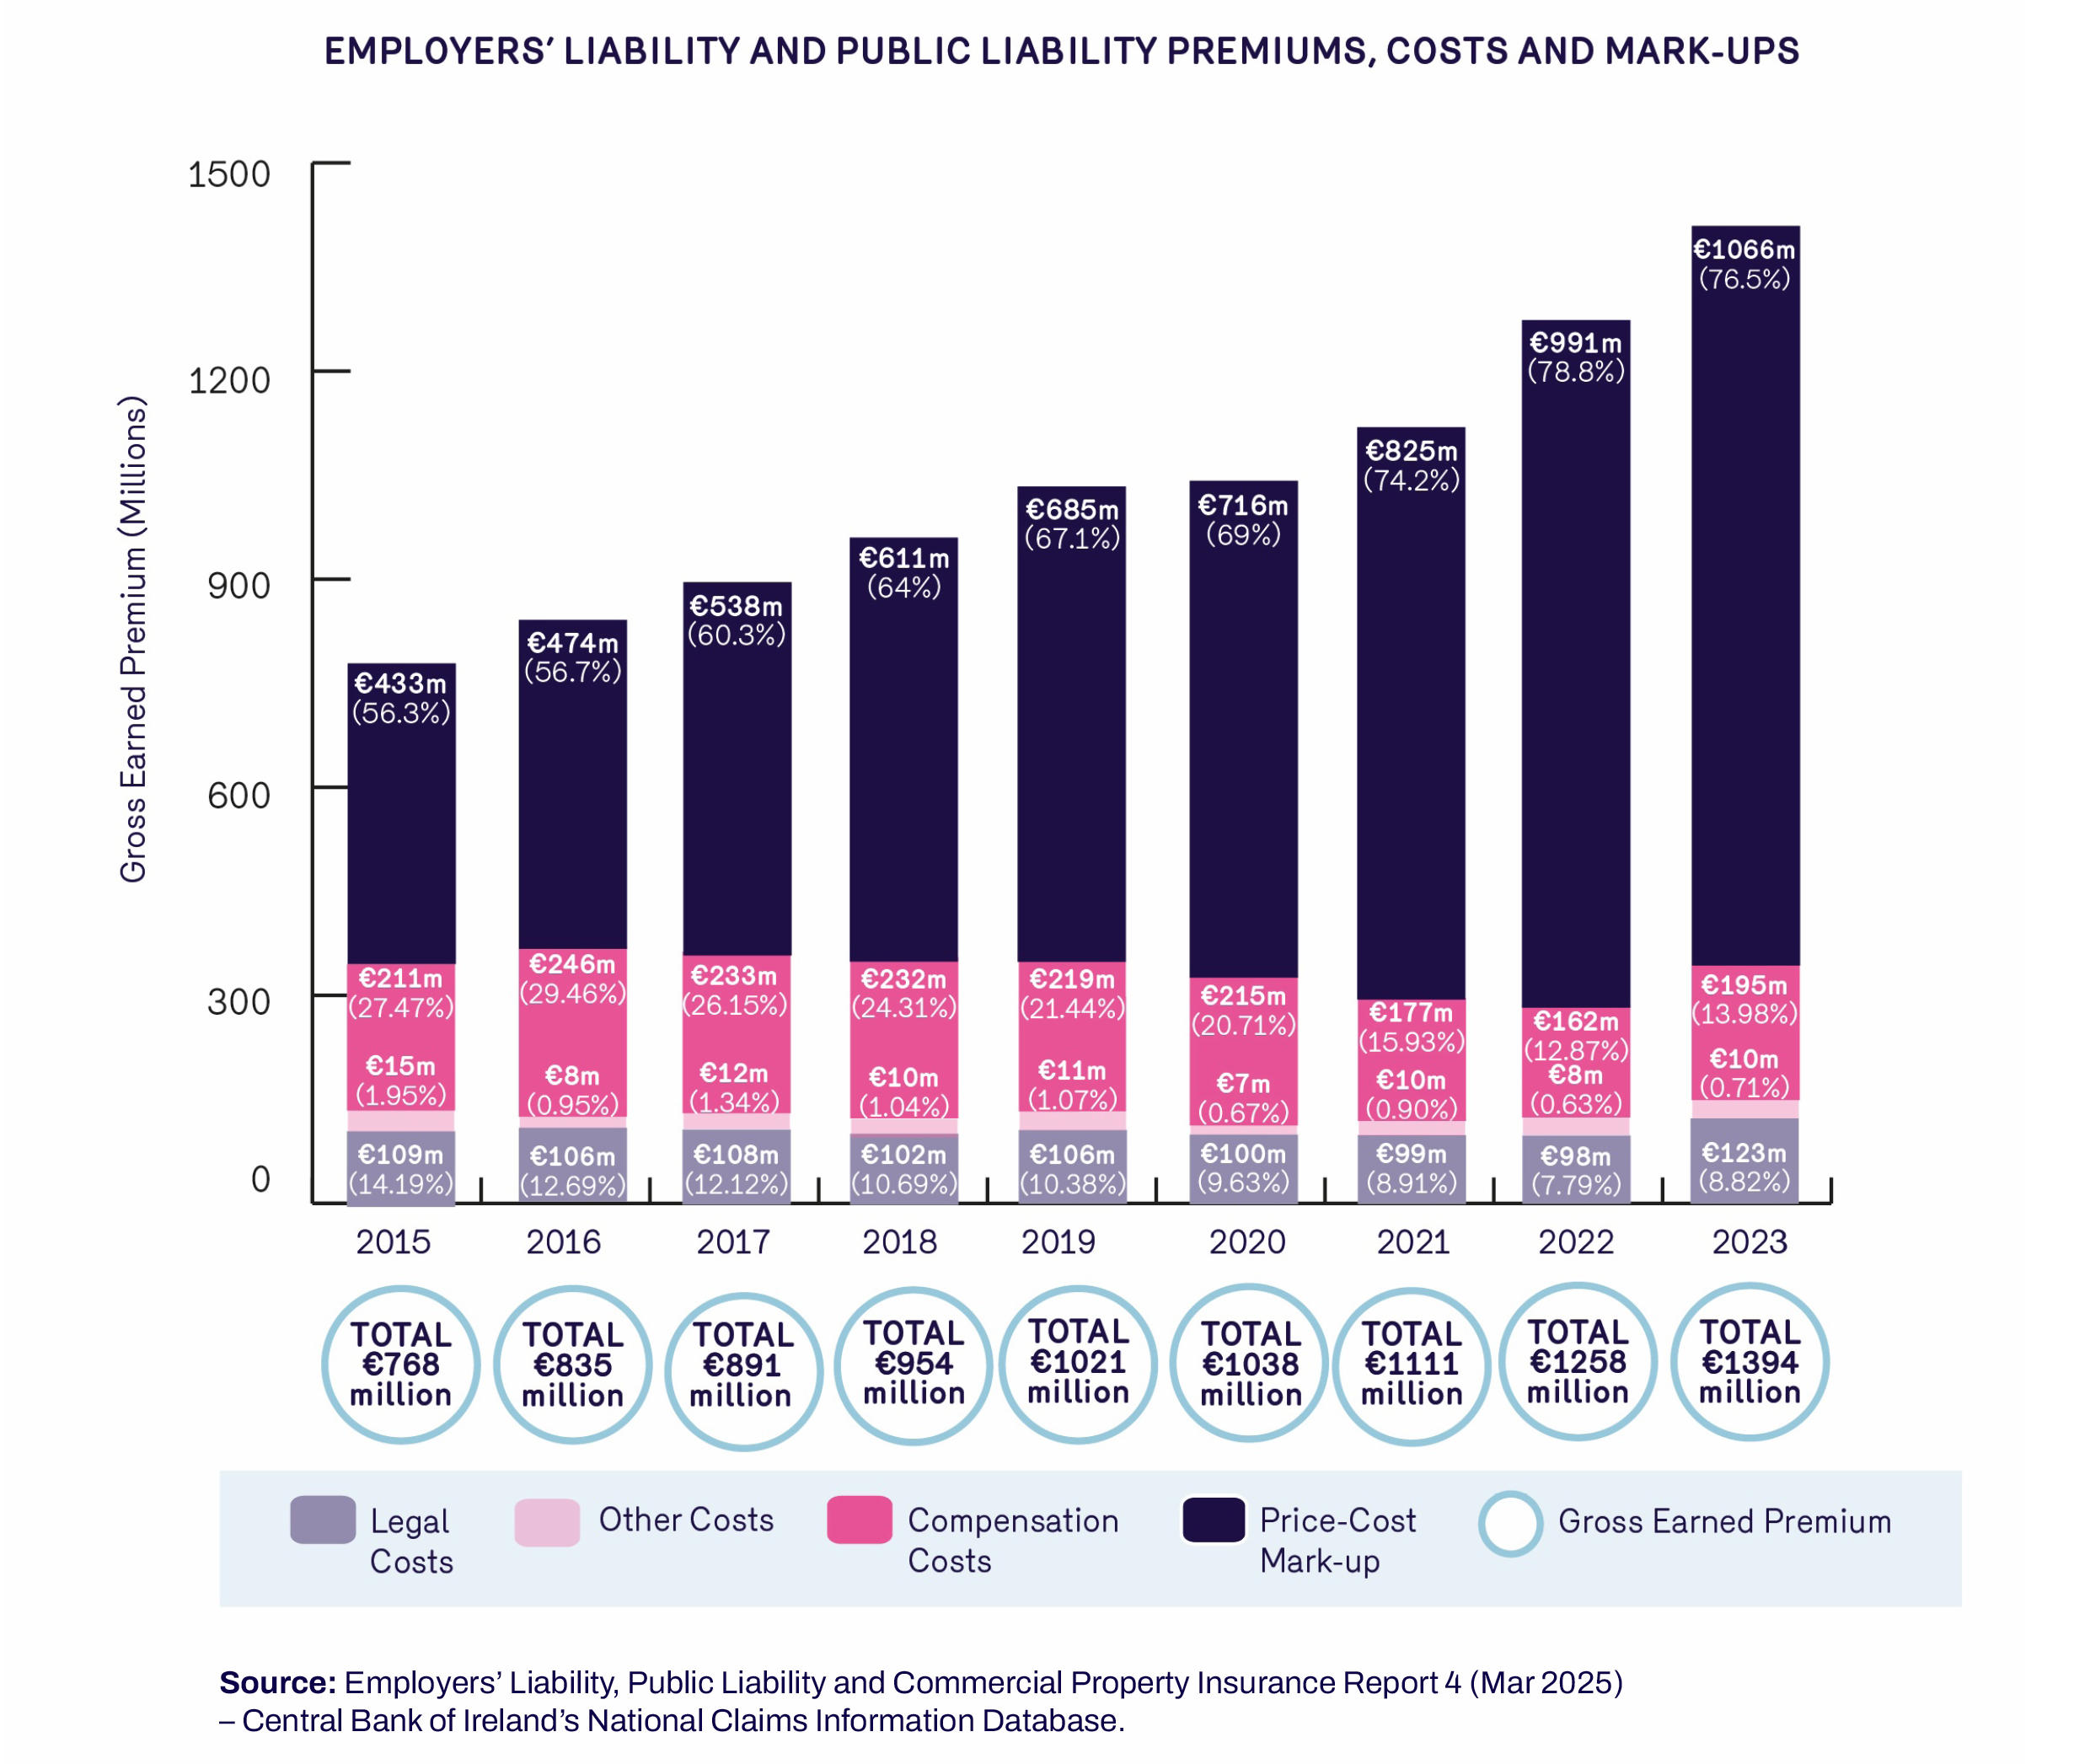
When you look the data available from the Central Bank over the last ten years,[5] it shows that, in respect of Employers’ Liability, Public Liability and Commercial Property Insurance, in each of the nine years examined, the costs of the insurers themselves was significantly higher than the amount paid out by the insurers to those who are insured.
The Law Society believes that a sustainable insurance industry is essential to a healthy economy and to ensuring that policyholders can fully exercise their right to make claims when they need to.
We also support the timely and efficient resolution of claims, and we recognise that, in many cases, the Injuries Resolution Board provides the most appropriate forum for resolving such matters.
The Law Society agrees with the Injuries Resolution Board’s recent call for the law to be changed to empower it to award legal costs in a much broader range of circumstances than is presently permissible and believe this will assist in resolving more claims at an earlier stage.
However, from the Central Bank data, it is clear that the legal costs could not have had any significant impact on rising insurance premiums and have in fact reduced as a portion of the gross premiums written during that time.
Based upon the past 10 years of data, legal costs represent, on average, 7.9% of a typical motor premium charged by an insurer, or 9% in the case of a typical premium for Employers Liability, Public Liability and Commercial Property premium.
While a profitable and sustainable insurance market is essential for a healthy economy, consumers have a right to understand what they are paying for — and why premiums continue to rise. They deserve full transparency around insurers’ own costs and the factors that drive profit. Only with this level of openness can we cut through deflection and create a fairer, more accountable system.
Blaming lawyers just isn’t going to cut it anymore.
(New data is due to be published by the Central Bank and the Law Society will analyse and share this data as soon as possible).
References
[1] Price-Cost Mark-Up is arrived at by subtracting Total Costs from Gross Written Premium. Source: Private Motor Insurance Report 7 (Oct 2025) - National Claims Information Database. Gross Written Premium drawn from Table 1, on page 12. Data on costs drawn from Table 9 on page 44.
[2] Source: Private Motor Insurance Report 7 (Oct 2025) - National Claims Information Database. Gross Written Premium drawn from Table 1, on page 12. Data on costs drawn from Table 9 on page 44.
[3] Source: Employers’ Liability, Public Liability and Commercial Property Insurance Report 4 (Mar 2025) - National Claims Information Database (NCID). Gross Earned Premium is drawn from Table 1 on page 15. Data on costs is drawn from Table 19 on page 54.
[4] Source: Private Motor Insurance Report 7 (Oct 2025) - National Claims Information Database. Gross Written Premium drawn from Table 1, on page 12. Data on costs drawn from Table 9 on page 44.
[5] Price-Cost Mark-Up is arrived at by subtracting Total Costs from Gross Earned Premium. Source: Employers’ Liability, Public Liability and Commercial Property Insurance Report 4 (Mar 2025) - National Claims Information Database (NCID). Gross Earned Premium is drawn from Table 1 on page 15. Data on costs is drawn from Table 19 on page 54.